Engineering Intelligence
You Can Trust
in the AI Era
The AI Trust Layer
for Enterprise Code
Prove ROI, reduce risk, and confidently scale AI. Measure productivity, quality, and AI-generated code impact directly from your source code using objective, enterprise-grade metrics.
Powered by insights from 20+ years of analysis across 800,000+ developers, 1.2M repositories, and 9 billion code revisions.
Performance Insights
Optimize developer performance through data-driven insights from coding activities.
Code Insights
Secure your codebase by detecting vulnerabilities and exposed secrets.
Talent Insights
Predict high-performing developer hires and optimize recruitment.
Active MultiSite
The Only True Active-Active Platform for Global DevOps.
Trusted by Global Leaders and Fortune 500 Companies
We help some of the largest companies improve productivity across their entire software estate.
out of 10 of the worlds biggest banks
of the S&P Top 50 Companies
of the Fortune 50 Companies
Measure What Matters
Track every tool, secure your code, and get data that stands up in the boardroom.
Accelerate AI adoption, maintain control. Our AI Trust Layer, benchmarked across 10B+ commits and 800k+ engineers, delivers the objective insights you need to build trust in AI, mitigate risk, and prove value.

Prove ROI on AI Spend
AI prompt counts and acceptance rates prove nothing. Objectively measure the productivity and quality gains, and translate these improvements into a clear, defensible ROI calculation. Understand the real financial value GenAI delivers to your business.
Reduce Risk in AI-Generated Code
Prove the provenance of your code while continuously monitoring for security risks, including leaked secrets, to prevent costly vulnerabilities and technical debt.

Gain Transparency & Control
Move beyond surface-level prompt counts and acceptance rate metrics or generic governance policies. Scale AI safely — without the guesswork
Why
BlueOptima?

Measure Coding Effort across your enterprise, projects, and teams to uncover opportunities

Track code maintainability and ensure developers create code that can be easily updated

Correlate code quality and developer productivity

Measure and analyze Global Drivers of Performance

Private and secure data throughout every level

Language detections for technology insights
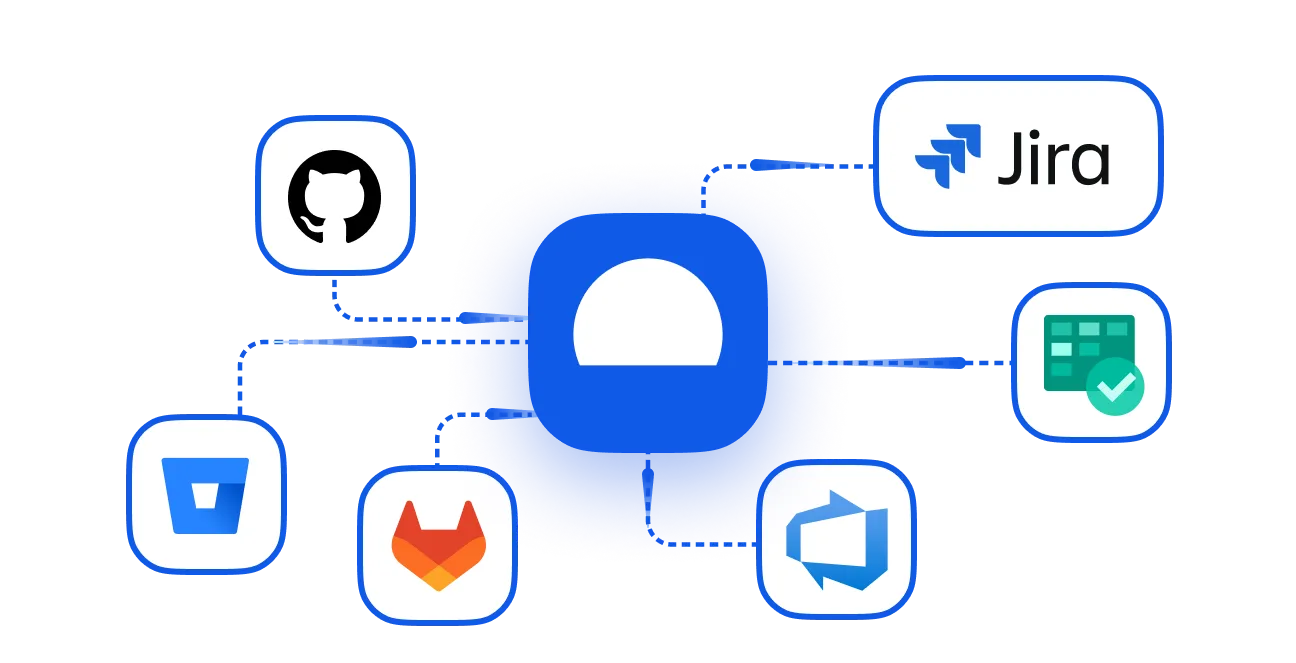
Integrates seamlessly with your entire workflow
Real Results for
Teams Like Yours
Developers
Scaling AI deployment
Rolled out a new AI coding tool across thousands ofdevelopers with full visibility into adoption and impact. By clearlydemonstrating productivity gains, they built the internal case to scale fasterand with confidence.

Improvement target
Driving measurable AI impact
Aligned leadership around a bold 50% productivity goal and gave teams a simple, trusted way to measure value delivered. This created momentum across the organization andturned ambition into action.
Increase in dev output
Validating AI gains
Measured the realimpact of Copilot-assisted development and proved a clear uplift inproductivity, with teams performing ~20% above the organizational average. Thismeant leadership could confidently plan AI adoption.
Increase in codequality
Validating AI gains
Uncovered hidden differences in code quality across globalteams and addressed them with clear, data-driven insights. The result: a 20%improvement in quality and more consistent engineering standards worldwide.
Saved
Managing global teams
Benchmarked productivity across onshore and offshore teamsto guide smarter resourcing decisions. Reduced cost per coding hour andimproved vendor performance, leading to $25M in savings.
secrets leaked
Eliminating security risks
Reduced exposedsecrets from 20 per month to zero by enabling developers to catch issues early.Strengthened internal security practices and eliminated a major source of risk.
Decisions
Backed By Data
Benchmark against industry leaders and global development hubs. Use BlueOptima metrics to increase software productivity in an ever-expanding market.
Developers worldwide
Velocity increase
Average productivity increase
.webp)


Powerful Tools.
Productive Teams.
Gain a clear, objective view of how coding effort is spent. Our platform shows you the breakdown between features, technical debt, and bug fixes, giving you the data to make smarter resourcing decisions.
Compare against our global benchmark to optimize for maximum impact.
Global Benchmark
Better Technology.
Cleaner Code.
Combine large datasets from various technologies to drive higher code quality and ensure your codebase supports innovation.
- Reduce technical debt.
- Improve code maintainability.
- Free up time to focus on new features.

Enterprise Features.
Standard Practice.
Single Sign-On (SSO)
Seamlessly integrate with your corporate identity provider via SSO for simplified user access and enhanced security control.
SOC 2 Type 2 compliant
Independently audited SOC 2 Type 2 compliance verifies our high standards for safeguarding your data security and confidentiality.
Zero Trust Policy
We enforce a Zero Trust security model, requiring strict verification for every access attempt to protect sensitive resources.